About Me

My photo
United States
I am a M.A. in industrial/organizational psychology. Most of my experience has been in human resources and change management. My passion lies in employee assessment, organizational development and employee opinions. Website: www.IanMondrow.com LinkedIn Profile: http://linkd.in/drBYoC

Monday, April 18, 2011

Seeking Work-Life Balance: Employees' Requests, Supervisors' Responses and Organizational Barriers

Summary and Commentary by: Ian B. Mondrow, M.A.

Work-life balance has become a sensitive topic for many employees. Daily needs, such as child care and elder care, require a significant amount of time and technology (such as blackberries and e-mail) have made it difficult to "leave work at work. Previous research on this topic has focused on the consequences of work-family conflict and the benefits of successfully managing the two. The balance is also important to employers as successful work-life balance is positively correlated with job satisfaction, life satisfaction, productivity, and attendance. Lauzun, Morganson, Major and Green (2010) set out to examine work-life balance in the context of company policies and organizational support.


425 supervisors [from a Fortune 500 company producing consumer goods] were asked to respond to 5 questions for each employee supervised. A total of 1,150 requests were reported. Figure 1 elaborates on the type of employees evaluated. Supervisors were ask the following questions when an employee made a request for work-life balance:


  1. Please provide the specifics of each employee's request.
  2. Did you accommodate the request?
  3. If you answered YES, how did you accommodate the employee's request?
  4. If you answered NO, why did you not accommodate the request? (Lauzun et. al., 2010)
The results were analyzed using a deductive open-coding approach and a codebook was developed to identify reoccurring trends. Two coauthors examined the data with the codebook and a high level of interrater reliability was established. 


In total, 1,150 work-life requests were received from employees. 752 of these requests were accommodated and 326 provided reasons for not approving the requested. 72 responses did not include data from the supervisor or the researcher could not properly code the data. The most frequent type of request for schedule changes or time to be off-site (n = 523). There was a high demand for work schedule flexibility (n = 265). Some employees even asked for the possibility to telecommute (n = 46). 


The second most common type of request focused on an employee's daily workload (n = 33). Many individuals felt that a collection of their meetings were not a valuable use of time. Previous research has found that meeting frequency is linked to daily fatigue and subjective workload (Luong & Rogelerg, 2005 as cited in Lauzun et. al., 2010). There were also requests to improve operating procedures.


The third most reoccurring requests were for resources to better assist the work-life balance (n = 230). This could include technology or additional staffing needs. 

A collection of employees requested social support and emotional support that did not fit into the other themes (n = 64), such as emotional support, compensation or on-site amenities. 

Figure two demonstrates the frequencies for the amount of requests and their themes. 


When responding to the requests, 58% of supervisors accommodated employees that expressed interest in schedule changes (n = 523) or accommodations (n = 301). 81% of requests for work resources were also approved, with 230 requests for resources and 186 accommodations. Solutions included coaching, training, increased/reallocation of staff and additional tools/equipment. 333 requests were made to change one's daily work but only 46% (n = 146) were approved. For an overview of results, please refer to Figure 3.

When examining requests for emotional and instrumental support, 119 accommodations were made when there were only 64 requests. Several reasons were identified for this difference: (1) supervisor communicated with employees when work/life balance requests were made and (2) supervisors provided support when they were unable to satisfy requests in an instrumental matter. 


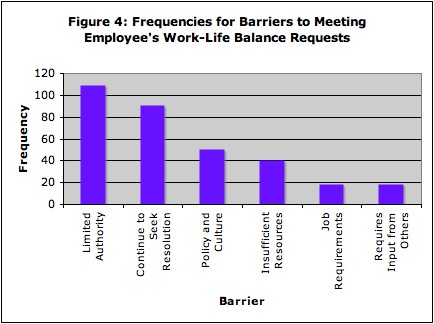
Further analysis of the data revealed several barriers that overpowered a supervisors ability to grant requests. A total of 326 were identified and sorted into 6 categories: authority, seeking resolution, policy/culture, insufficient resources, job requirements, and multiple involvement. 109 requests were denied because the supervisor lacked the authority to authorize the request. It was also found that 40 requests were not approved because the appropriate staffing or funding was not available (Resources). Several requests were denied because of organizational policy or norms (n = 18) and and others were denied because the job requirements (n = 18) forbid such a requests. Supervisors were unable to approve all the requests and some needed the involvement of other parties (n = 18). Although many requests were denied, there were 91 instances where a supervisor continued to pursue the request for his/her employee. Pleasure refer to Figure 4 for a visual layout of the results.

This study produced several findings. Flexibility in work time and location seems to be the greatest in demand for work-life balance. Telecommuting can also benefit employers as it can reduce building and maintenance costs. It was also found that adjusting work responsibilities and providing additional resources could assist in work-life balance.

A variety of limitations exist in this study. First and foremost, the study was based upon self-report data and therefore the data is vulnerable to recall bias. Additionally, subordinates may be hesitant to make requests to their supervisor in fear of negative consequences. Another vital limitation is that the study focused on one organization and therefore cannot be applied to the population.

IMPLICATIONS FOR HUMAN RESOURCES
As one of the few qualitative studies to examine work-life balance, this study produces some interesting findings. However, it also suggests valuable information for human resources. One key point is that human resources professionals should empower managers to control the schedules of their employees. There should be no need for managers to obtain input from others or to seek alternative resolutions. This can discourage employees from making future requests and create anxiety as they wait to hear if their request is approved. Supervisors should have a general understanding of the needs of their departments and thus have no need to check with others. If this were my company, I would likely investigate why input is needed from others. It is possible that this manager needs assistance in managing resources.

Flex-time was identified as one of the most common requests among employees. Given today's technology and globalization, it is sometimes in a company's best interest to allow employees to telecommute. As mentioned by the researchers, it can reduce costs of upkeep and properties. It also makes it easier to find the most suitable candidates for open positions, as a company does not need to limit their search to local candidates. There are incidents when telecommuting is not possible or it does not align with the company culture. A company must weigh the benefits and draw-backs to determine if telecommuting is compatible with the organization's needs.

It is reassuring to see that managers are likely to provide emotional support when requests are not approved. However, managers should always be emotionally supportive of their team. Support fosters trust, and an employee that trusts his/her manager is more likely to be committed to the job. Managers do not need to be best friends with their employees but they should be able to talk to employees when they notice unusual behavior. For instance, after taking a call, my co-worker becomes immediately withdrawn. After noticing this, my managers takes her to the parking lot to talk. She later hands her the keys and says,"if you need to go home, I will understand". That is support and it strengthened the relationship between my coworker and my manager. Heck! It made me view my manager in a whole different light!


Source: Lauzun, H.M., Morganson, V.J., Major, D.A., & Green, A.P. (2010). Seeking work-life balance: Employees' requests, supervisors' responses, and organizational barriers. The Psychologist-Manager Journal, 13 (3), 184-205.

Wednesday, April 6, 2011

Can personal control over the physical environment ease distractions in office workplaces?

Summary and commentary by Ian B. Mondrow, M.A.

Personal control is defined as the perceived control an individual has over various characteristics of his/her environment, which includes: (1) the organization of one's workspace; (2) personalizing one's workspace; (3) control over social contact; and (4) control over temperature, lighting and the work process (Lee & Brand, 2009). Distraction is the extent to which an individual feels diverted, disturbed or annoyed by an unwanted stimulus in the work environment.

Little consensus has been achieved on  on control in the workplace, therefore much of the information was obtained from previous studies to create the control construct for this study. 9 items were developed to measure control using a 7-point likeart scale. Statements were collected from a previous study conducted by Weisman (1986) which measured concentration and noise level. 8 statements were extracted and utilized a 7-point likeart scale. Finally, one's judgement on his/her performance was collected based on Oldham's (1988) aspects of quality, quantity and creativity. These items were scored on a 5-point scale.

A sample population was collected utilizing three manufacturing companies based in Michigan. A total of 384 surveys were analyzed. Information about the physical aspect of each building was also collected, including, year constructed, facility size, renovation history, distribution method of HVAC systems and workspace specifications.

Demographics include the following:

  • 62% male; 38% female
  • 28% worked in engineering; 12.8% worked in marketing; 58% were employed in engineer/technical/ professional positions; 24% were managers; 13% were clerical/support and 4.2% considered themselves as other
  • 74% worked in an open office  with high dividers
  • Office type varied based on job category (i.e. clerical personnel were more likely to work in a cubicle and a professional is more likely to have an office
The analysis methodology was unclear and questionable. It is possible that I may not have a background in this methodology but there was no p-value to designate the significance of the results. However, the authors state that perceived control over the physical environment environment mediated the negative effects of distraction on one's performance.  Therefore, the negative effects of distracting noise can be decreased by providing employee's control of their personal work place. 

Results need to be interpreted delicately as they were collected based on self-report. Clearly self-report surveys are vulnerable to biases. 

IMPLICATIONS FOR HR PROFESSIONALS
While the topic requires further research, it does reveal some helpful information. First and foremost, private offices are the ideal workspace for any employee, as it dramatically reduces the possibility of distractions. However, private offices for every individual employee is not always feasible and therefore, companies often resort to a public work environment.

When a public work environment is needed, employers should try to eliminate distractions as much as possible. One popular method is to use cubicle walls to provide employees with privacy. Some companies choose to avoid cubicles due to the stigma it can create. Even with cubicles, distractions, such as noise, are impossible to avoid. This article suggest increasing an employee's sense of personal control can assist them in blocking external distractions. Simple yet effective methods can be used, such as: 
Believe it or not, it is possible to get cubicles with doors
  • Instead of using overhead fluorescent lights, give employees lamps with a dimming feature
  • Allow employees to layout furniture
  • Encourage employee's to decorate their desk with pictures of their liking
  • Allow employees to which desk they want to sit at (if possible)
  • Enclose a cubicle and give employees the right to have a door


Source: Lee, S.Y., & Brand, J.L. (2010). Can personal control over the physical environment ease distractions in office workplaces? Ergonomics, 53 (3), 324-335.

Monday, March 21, 2011

Resume or curriculum vitae?

Summary and commentary by Ian Mondrow


Throughout my career, I have met people of different backgrounds. Some people have doctorates, others have been working for fifth-teen years and some people are just entering the job market. It was not until I applied for my friend's former position, that I realized some people use curriculum vitae (CV) instead of a resume. I decided to investigate this methodology further by asking my HR and recruiter friends. 


A survey was developed using Google docs and participants were obtained via LinkedIn and LinkedIn. In total, 12 participants completed the survey. Of these participants, 4 of them were human resources professionals, 4 worked in the recruitment industry, 3 were company owners and 1 person identified themselves as other. All participants were asked to rank a collection of statements based on a 5-point likert scale of agreement (1 = disagree and 5 = agree). Below are the following statements that were assessed:


  1. A resume should only be one page.
  2. A curriculum vitae works just as well as a resume.
  3. A curriculum vitae is best suitable for a PhD or PhD ABD.
  4. An individual with a graduate degree can have a resume that is more than one page.
  5. A resume can be more than one page if a candidate has enough job experience.
  6. A curriculum vitae is only applicable for jobs in academics.
  7. A curriculum vitae is only applicable for jobs in research.
  8. Bachelor graduates should not use a curriculum vitae.
  9. A resume is far more effective than a curriculum vitae.
  10. Recent graduates should apply for jobs with a curriculum vitae.
RESULTS
Figure 1: A resume should only be one page
Questions 1, 4, and 5 questioned respondents on the lengths of resumes and their preferences. Contrary to the teachings of many career centers, 10 out of 12 respondents disagreed that resumes should only be one page. Furthermore, no respondents agreed with that statement. Figure one demonstrates these results in a bar graph. Questions 4 and 5 continue by asking if there are exceptions to the 1 page standard. 9 out of 12 respondents agreed that it is more acceptable for individuals with advanced degrees (i.e. Masters, PhD, etc.). Moreover, all participants agreed that it is acceptable to have more than one page if an individual has enough job experience. Figure 2 demonstrates their agreement in a bar graph. 


Items 2,3 and 6-10 focused on the usage of a CV instead of a resume. As expected, most participants agreed that a CV is best for candidates with a PhD, at least according to 10 participants. It was expected that CVs would be preferred for academic or research jobs but there was no consistent pattern between participants. Please refer to figure 2 and 3 for a representation of these results. Surprisingly, no one completely agreed with statements 6 and 7. The usage of the word "only" in these statements may have impacted the results.


Figure 2: A CV is only applicable for jobs in academics

Figure 3: A CV is only applicable for jobs in research
Results continued to shock as no participants showed any agreement to item 10, which states that graduates should use a CV. In general, there was no preference between a CV or a resume.


CONCLUSIONS
In general, one's job experience seems to be the determining factor of resume length. If an individual has enough experience to fill more than one page, it is more acceptable to include 2 pages if the content consumes at least half of the second page. One respondent mentioned that recruiters won't read 2 pages but all participants agreed that having a 2 page resume can be beneficial if it contains significant accomplishments and relevant information. 


The only exception to that rule is if an individual utilizes a CV. CVs are generally longer in length. Using a CV instead of a resume appears to be personal preference and hiring managers have their preference as well.  When participants were asked if they prefer a CV or a resume, most of them responded that it varied on the market and the job. Therefore, job applicants should conduct research to determine if a resume or CV would be more suitable. 


Figure 4: A CV is only applicable for jobs in academics
There are several limitations to this study. First and foremost, the participants are not a true representation of the population. This representation is difficult to achieve with only 12 people. Second, the size of the participant pool can drastically alter the results of a study. The fewer participants that participate, the more weight their market has. 


Thank you for all those who have participated!

Monday, March 14, 2011

Can Counterproductive Work Behaviors Be Productive?

Summary and Commentary by: Ian B. Mondrow , M.A.

Counterproductive work behaviors (CWB) are acts consciously conducted by employees that have the ability to negatively impact an organization and/or its members. Spector et al. (2006) has suggested that there are five categories of CWBs including: abuse towards others, sabotage, theft, production deviance (i.e. working slowly), and withdrawal (i.e. taking longer breaks). CWBs may be a result of emotional exhaustion, or the feeling of being worn down as a result; often the result of burnout.  Emotional exhaustion has been found to be  related with turnover, cardiovascular and sleep problems, decreased motivation, decreased task performance, and citizenship behaviors.

It has been suggested that CWBs  are a coping mechanism to reduce stress from a negative situation. Coping is a cognitive or behavior action that one takes in response to stress. CWBs provide individuals with a sense of control over stressful situations. This article focuses on withdrawal and production deviance. Withdrawal and production deviance reduce employee exhaustion by giving individuals the opportunity to return to their normal emotional state. Withdrawal behaviors include actions such as taking longer breaks or leaving early for the day. While outside of the work environment, an employee's frustration decreases and allows an him/her to return to a calm state of mind. Production deviance is when an individual intentionally works slowly, does work incorrectly [intentionally],  or ignores procedures. These actions allow the individuals to "even the score" when confronted with injustice and may reduce emotional exhaustion.


Organizational justice is the how an individual perceives the fairness between individuals and the organization. It is composed of distributive justice and procedural justice.  Distributive justice is the perceived fairness of reward and recognition, while procedural justice refers to the fairness of the process by which decisions are made. Organizational justice may have the ability to influence the occurrence of CWBs within an organization.


Krischer, Penney and Hunter (2010) utilized StudyResponse Project to recruit 522 participants; of which, 295 were examined. Although it was requested that participants be employed full-time, 20.8% of the respondents were employed part-time. After careful analysis, it was determined the two groups were not significantly different. Participants completed a self-evaluation of the following:
  1. Price & Mueller's (1986) six-item scale to measure distributive justice (1 = very unfairly; 5 = very fairly)
  2. Moorman's 12-item scale to measure procedural justice (1 = strongly disagree; 5 = strongly agree)
  3. 3 items from the Counterproductive Work Behavior Checklist (Spector et. al, 2006) to measure production deviance (1 = never; 5 = everyday)
  4. 4 items from the Counterproductive Work Behavior Checklist to measure withdrawal  (1 = never; 5 = everyday)
  5. 6 items from the Job-Related Affective Well-Being (JAWS) Scale to measure emotional exhaustion (1 = never; 5 = always)
JAWS is not typically used to measure emotional exhaustion but 2 subject-matter experts identified items that closely relate to the definition of emotional exhaustion.

Results were collected by conducting intercorrelations and descriptive statistics. It was found that both distributive justice (rs = -.38, p < .01) and procedural justice (rs = -.41, p < .01) had a moderately negative correlation with emotional exhaustion. This suggests that if an individual perceives an organization to have low distributive justice or low procedural justice, he/she is more likely to be emotionally exhausted.

A hierarchical linear regression was also utilized to analyze the two types of justice, withdrawal, and production deviance. A strong interaction was found between distributive justice and withdrawal behaviors, R2 = .60, p < .01. It may be assumed that if an individual feels rewards are not fairly distributed, then he/she is more likely to withdraw. Distributive justice and production deviance also produced moderately significant results,R2 = .50, p<.05, suggesting that if distributive justice is perceived as high, one is less likely to conduct production deviance acts. Finally, procedural justice also had a moderate relationship with withdrawal, R2 = .42, p < .05, suggesting that withdrawal is less likely to occur when an individual feel procedural justice is served. No interaction was present between procedural justice and production deviance.

No significant findings were present when an individual admitted to high levels of production deviance. However, those who had low levels of production deviance had a negative relationship with between distributive justice and emotional exhaustion, r = -1.17, p < .01. Results continued to show that Individuals with low levels of withdrawal were more likely to be emotionally exhausted when they perceived procedural justice as low, r = -1.37 & -1.06, p <.01).

SUMMARY WITHOUT ALL THE STATS
Results show that if employee perceive their workplace to have higher levels of  justice, it will increase their well-being and reduce the need for coping behaviors. However, when justice is seen as low,  employees are more likely to exhibit CWBs as a coping mechanism . The researchers suggest that CWBs may be used to shape an employees emotional experiences at work, rather than a reaction to experiences.

Contrary to the researchers' hypothesis, the results showed that production deviance is not a coping mechanism for perceived procedural justice. Instead, it may be suggested that production deviance requires active engagement and therefore requires low levels of withdrawal to uphold, whereas withdrawal behaviors are far more passive.

IMPLICATIONS FOR HR PROFESSIONALS
The following study demonstrates the importance of organizational justice. Employees that perceive unfair organizational justice are more likely to withdrawal and be less interested or committed to their work. HR professionals can use their symptoms to their advantage. If employees  are observed exhibiting withdrawal behaviors (i.e. leaving early regularly, taking longer breaks, taking extra breaks, etc.), HR can begin to question both procedural and distributive justice within the organization. If this is an area of concern, surveys can be used to effectively measure personnel's perception of organizational justice. It is suggested to utilize a consultant with a background in industrial/organizational psychology or psychometrics to ensure that the survey is accurately measuring perceptions. 

HR can also use these findings to their advantage. CWBs can be prevented by ensuring employees are empowered. This can be succeeded through a fair grievance system or implementing a skip-level reporting system. Furthermore, emotional exhaustion can be prevented by providing employees with outlets for their stressors such as exercise programs or facilities. Organizations should also encourage employees to take break to ensure they can take time to restore their energy. 

The study also reveals scary findings. Employees that are likely to conduct production deviance are less likely to appear emotionally exhausted or withdrawn. This makes it far more difficult to identify employees that may be conducting counterproductive behaviors. In reality, it means that an engaged and supportive group of employees could contain an individual that exhibits negative behaviors. It is up to management to properly observe their employees and to measure performance on a regular basis. It is best to be proactive than reactive. Therefore, encourage employees to speak up when they observe deviant behaviors. 


Source: Krischer, M.M., Penney, L.M., & Hunt, E.M. (2010). Can counterproductive workbehaviors be productive? CWB as emotion-focused coping. Journal of Occupational Health Psychology, 15(2), 154-166.

Monday, February 21, 2011

Can heterosexism harm organizations? Predicting the perceived organizational citizenship behaviors of gay and lesbian employees

Summary and commentary by: Ian Mondrow

Employees who are open about their sexual identity have an increased chance of confronting workplace discrimination. Some instances can include: glass ceiling effect, loss of credibility and less positive regard from their peers. An organizational culture with a strong emphasis on heterosexism (the lack of concern for members of the GLBT community) has previously been found to predict the self-disclosure of sexual minority employees. Previous research has found that the stereotype of being gay instills a higher sense of self-focus, or monitoring one's actions. Stigmatization salience is defined as an individual's self-focus to the membership of a culturally stigmatized group (such as sexual orientation).

OCBs are positive work behaviors that increase the performance of an organization. Helping behaviors and organizational compliance are two OCBs that will be utilized in this study. Help behavior is the voluntary effort to help others. Organizational compliance is the following of organization policy.

Data was collected from an online national study of gay and lesbian individuals. Individuals that identified themselves as bisexual were excluded from the sample as their experiences may differ from gays and lesbians. A total of 606 employed individuals were included in the sample. The sample was split into two groups: 311 participants were in the testing group and 295 participants were placed in the validation sample.  Four vignettes from the Organizational Tolerance for Heterosexism (Waldo, 1999) was used to assess organizational climate for each participant. Workplace outness was measured using three items from Mohr and Fassinger's (2000) outness indicator. Stigmatization silence was measured by six items created by the authors of this article. Finally, seven items were utilized from the sub-scales of Smith et al. (1983).

A goodness of fit model (correlation) was utilized for the analysis. It was found that heterosexism within an organization's climate did impact one's ability to be out. Stigmatization salience was negatively related to both organizational climate and outness. Finally, workplace behaviors were positively predicted of being out. Findings were verified with similar results from the validation sample.

**Correlation statistics to be posted later today**


IMPLICATIONS FOR HR PROFESSIONALS
To put it shortly, the ability to be out and open has a positive impact on performance. A workplace culture that heterosexist focused is more likely to increase stigmatization salience and hinder one's ability to be out.

The study clearly demonstrates the toxicity of a heterosexist environment. Gay and lesbian individuals are continually monitoring their behavior and weary of any indicators that they may demonstrate. The truth is that organizations should embrace the differences between every individual. Since diversity increases innovation, what benefit does a heterosexist culture provide? Basically it is merely encouraging gender norms for both men and women, regardless of one's sexuality. Therefore, one could be heterosexual but still be cautious of their behaviors as they do not want their coworkers to think they are gay. Therefore, a heterosexist environment is not only harmful to gay and lesbian employees but any individual that is a member of the organization.


Source: Brenner, B.R., Lyons, H.Z. Fassinger, R.E. (2010). Can heterosexism harm organizations? Predicting the perceived organizational citizenship behaviors of gay and lesbian employees. The Career Development Quarterly. 58, 321 - 335.

Sunday, February 6, 2011

Making Transfer Climate Visible: Utilizing Social Network Analysis to Facilitate the Transfer of Training


Summary & Commentary by Ian B. Mondrow, M.A.

The transfer of training is when current knowledge, skills and abilities have an impact on the learning of new skills or knowledge. There are three main players involved the in the transfer process, including: the learner, the manager and the trainer. The climate of transfer is influenced by the perceived support of managers/peers, the ability to utilize the new knowledge learned, and the perceived outcomes of applying the new training content.  Climate plays a key role in whether or not the transfer of training is successful, and the communication network determines the climate.

The social network theory is the study of how interpersonal relationships within a department or whole organization affect the beliefs and opinions of other individuals. Wasserman and Faust (1994) concluded several assumptions in regards to social networks: (1) actors and their actions within networks are influenced by the actions of others; (2) connections between individuals is can be a formal or informal route for information sharing; (3) network models can identify any barriers in the successful transmission of information. Social networks can be utilized to identify key contributors with an extensive outreach who may have drastic impact on a training transfer's success.

Social networks can be analyzed with either the ego network analysis or complete network analysis. An ego network analysis examines the communications exhibited by one individual. This type of analysis is useful in examining individuals participating in a training in isolation from the rest of the organization. The complete network analysis  examines a group of individuals (whether is a team, department or entire organization) and the communication streams within the group. Collecting information for either analysis can be achieved through observations, interviews, surveys or archival documents. Data can be measured in two ways: (1) Using the numbers 0 and 1 to show the existence of a relationship and (2) using a likert scale to show the degree in which two individuals interact with one another. Once this data is collected, data can be analyzed using UCINET 6 and the network maps can be developed using NetDraw. An example of a social network map is shown below.

The social network data can be extremely useful in the implementation of training. Key actors in the networks can be used to determine what/why training is needed, obtain feedback on training content, determine the best methodology to deliver training, how to increase the transfer of training and encouraging others to use the information learned in training. Additionally, the network results can be used to determine what groups are for or against the new training. Once identified, researchers can examine these groups to determine why the outliers are not supportive. 

IMPLICATIONS FOR HR PROFESSIONALS
Social Network Analysis is a new statistical analysis that has recently been introduced into the business sector. Therefore, its credibility may be questionable to high level executives, especially if only data is presented. Utilizing the visualization of the maps assists in overcoming resistance as it shows all connections and the magnitudes of each individual within a network. Explaining the network is only half the battle. One must be able to explain how these results will be used within the organization.

The results can prove to be especially useful in large organizational changes. The network can identify key individuals that communicate across the organization and have high credibility. Much like a change agent network, these individuals can be used to ensure that the correct messages are being communicated throughout the organization (i.e. killing inaccurate rumors before they begin). The support of these individuals can also assist in proving the value of the change to the rest of the organization. As mentioned earlier, these individuals are also valuable in providing feedback about training and how to improve the facilitation methods. 

This method can be costly and time lengthy therefore it would not be effective for small initiatives but rather large scale changes. In addition, HR professionals should not attempt to conduct the analysis themselves. Instead, it is suggested they hire someone with a background in industrial/organizational psychology or psychometrics. Although costly, the benefits of this analysis can be extremely beneficial in large scale changes. 


Source: Hatala, J.P. & Fleming, P.R. (2007). Making transfer climate visible: utilizing social network analysis to facilitate the transfer of training. Human Resource Development Review, 6 (1), 1-31.

Monday, January 31, 2011

How to (and how not to) assess the integrity of leaders


Summary & Commentary by Ian Mondrow, M.A. in Industrial / Organizational Psychology

Ethics and integrity are often used interchangeably but they are clearly differentiated. Ethics are the desirable behaviors established by society that establish “right” and “wrong” for its members (Pojman, 1995 as cited in Kaiser & Hogan, 2010). In contrast, integrity is the moral attribution we apply to one’s observed behavior (Kaiser & Hogan, 2010). Current assessments are unable to measure integrity directly and therefore it is indirectly measured through other constructs, such as the Five-Factor Model of personality. Unfortunately, Personality does not predict future behaviors.  It is suggested that measuring one’s personality results in skewed results and managers tend to be rated higher than they actually are. One’s previous experiences and reputation provide a more reliable source for measuring one’s integrity.

Kaiser & Hogan (2010) decide to research the use of integrity testing in more detail. Data was collected from 672 directors and vice-presidents from Fortune 500 companies and included ratings from approximately 5 subordinates for each individual. Using a 23 item questionnaire with a 5 point likert scale (0 = ineffective and 4 = extremely effective), leaders were assessed on 5 competencies: vision, execution, managerial courage, building talent and integrity. A t-test demonstrated that integrity scores were generally higher than any other construct. The smallest difference (which was statistically significant) occurred between integrity (M = 2.68, SD =.40) and execution ( M = 2.31, SD = .42) with a difference of .92 in standard deviation, t(671) = 22.88,  p < .001. Not one leader received a score of 1, which is considered minimally acceptable. A tukey’s post examination revealed no statistical significance for integrity. This demonstrates that this method does not effectively differentiate those with low integrity from those with high integrity. It continues to reveal that managers are always provided favorable scores when being assessed on integrity.

Following the initial study, Kaiser & Hogan decided to try a new approach of assessing integrity. The approach does not ask evaluators to refer to observed behavior but asks the likelihood that a manager will engage in questionable behavior. 80 students from a southeastern university were recruited to participate in the following study. Participants were asked to rate their current managers using the Leader Behavior Description Questionnaire (LBD) – Form XII (Stogdill, 1963) and the shortened version of the Perceived Leader Integrity Scale (PLIS) [focusing on perceived integrity]. Unlike the LBD, higher scores on the PLIS are less desirable as a higher score demonstrates a greater probability of unethical behavior. Additional items were used to measure the perceived effectiveness of a supervisor and job satisfaction. The smallest difference occurred between initiating structure (M = 2.37, SD = .83) and  perceived integrity (M = 2.66, SD = .97), t(79) = 3.48, p < .001. Participants were more comfortable rating managers below the median (2), which did not even occur in the previous method, Therefore, the PLIS is three times less elevated than the previous methodology, which had a standard deviation of .90. The analysis also exposed that the PLIS correlated with job satisfaction and perceived effectiveness of a manager. It can be assumed that if managers are perceived as ethical, employees will generally have higher levels of job satisfaction.

There are several limitations to consider in this study. First off, the samples in both studies are entirely different. Students may rate managers differently as there is less of a chance that they work full-time. They may have also worked for different companies and therefore was a variance in organizational culture.

IMPLICATONS FOR HR PROFESSIONALS

It is important to mention that if ethical testing is used in any selection process, it must demonstrate validity. Therefore, a company must be able to demonstrate that the test predicts successful performance in case the test experiences adverse impact.

Organizations can now more effectively measure the integrity of their employees by utilizing a system similar to the PLIS. Instead of measuring personality, the assessment can focus on the likelihood that one will perform unethical behavior. There is no need to argue why as the study above provides statistical proof. To increase its creditability, upcoming studies should look at a variety of samples to ensure it is applicable to the real world. 

The study does provide significant findings that are applicable to performance appraisals. Since the perceived integrity is found to increase job satisfaction, which can reduce turnover and increase performance. It is better to be proactive than reactive when battling integrity. By instilling a culture that values ethical behavior, managers are less likely to participate in questionable behavior. Encouraging executives to communicate and model the ethical behaviors can reinforce the culture. Supervisors that are already demonstrating unethical behavior or low levels of integrity can be difficult to develop, especially since their creditability may already be shot.


Source: Kaiser, R.B., Hogan, R. (2010). How to (and how not to) assess the integrity of managers. Consulting Psychology Journal: Practice and Research, 62(4), Dec 2010, 216-234.